
Population Dynamics for Tracking Wildlife Populations Through Time
In wildlife conservation and management, population estimates are highly desired information and tracking them gives important insights about the health and resilience of a population through time. For example, Wisconsin Department of Natural Resources (WI DNR) annually estimates the size of the deer population in more than 80 Deer Management Units (roughly the size of counties). Fun fact – Snapshot Wisconsin contributes data on deer fawn-to-doe ratios to make these population estimates possible.

Annual population growth can be estimated by dividing the population estimate in the current year by the population estimate in the previous year (we call this growth rate lambda). A lambda = 1 is a stable population, a lambda < 1 is a declining population, and a lambda > 1 is a growing population.

Examples of graphs showing stable, growing, and declining populations based on their lambda value.
What leads to the stability, growth, or decline of a population is the foundation of population dynamics. Population dynamics are a way to understand and describe the changes in wildlife population numbers and structure through time. The processes for growth are births and immigration into the population, and the processes for decline are deaths and emigration away from the population, which leads to the following formula at the heart of population dynamics:
Population size this year = Population size last year + births – deaths + immigrants – emigrants

These young turkey poults would contribute to the number of “births” in a population estimate for turkeys.
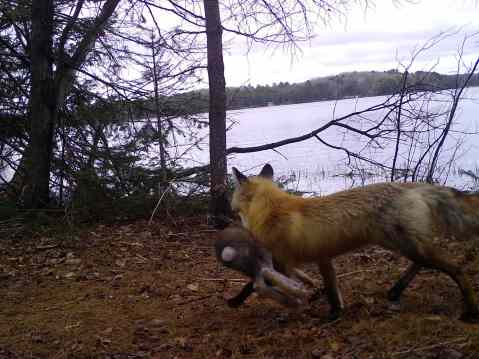
This cottontail fell prey to a red fox. Animals that have died would contribute to the number of “deaths” in the population estimate for their species.
In established wildlife populations we often focus solely on the births (called recruitment) and deaths within a wildlife population and assume immigration and emigration are equal and therefore cancel each other out.
For deer, the birth part of the equation is captured by those fawn-to-doe ratios mentioned earlier, and the death portion is estimated as a combination of mortality sources. One source is deer harvest, and because Wisconsin requires registration of harvested deer, we have a pretty good understanding of this mortality source. Other mortality sources are from natural causes and are best assessed through radio-collaring and tracking deer through their lifetimes.

This deer is part of the WI DNR’s radio-collar tracking program.
Bobcat and fisher are two other Wisconsin species whose births and deaths are estimated annually. For these species, the recruitment into each population is estimated from our understanding of how many kittens (bobcat young) and kits (fisher young) are born into the population. The data come from the reproductive tracts of harvested females. The reproductive tracts contain scars for each placenta that was attached, thereby providing information on pregnancy rates and litter sizes. Similar to deer, information on mortality in these population comes from registered harvest and estimates of other non-harvest sources of mortality collected from radio-collaring research studies.
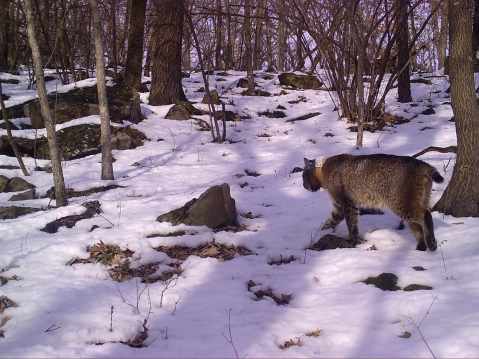
A bobcat with a WI DNR radio-collar.

Bobcat kittens captured on a Snapshot Wisconsin trail camera.
We are developing ways for Snapshot Wisconsin to contribute to our understanding of wildlife population dynamics. A real value of Snapshot Wisconsin is that it tracks all types of wildlife. For each species, we can develop metrics that will help us better track its population dynamics, and therefore gain a better understanding of the current status and trajectories of our wildlife populations.
One of these metrics is the proportion of cameras that capture a photo of a species within a time and spatial area. We can treat this metric as an index to population size, which is very useful for tracking populations across space and time. If we see a trend in the proportion of cameras in some part of the state showing an increase or decrease in this metric, that gives us information about the distribution and movement of species. For example, the southern border of fisher distribution in Wisconsin (currently around the center of the state) has been thought to be shifting further south. This metric can help us document when and where this shift may be occurring. This metric is now tracked for 19 Wisconsin species on the Snapshot Wisconsin data dashboard.
In the following graphics, you can see the proportion of trail cameras detecting bobcat in each ecological landscape of Wisconsin in 2017, 2018 and 2019. The patterns are consistent across these three years and show the distribution of bobcats is across two-thirds of the state. We will be tracking this metric and others for bobcats, as well as for other Wisconsin species.

Maps showing proportion of bobcat detections on Snapshot Wisconsin cameras in different ecological landscapes in 2017 (far left), 2018 (middle), and 2019 (far right).
The power of Snapshot Wisconsin is just beginning to emerge as we are collecting consistent, year-round, and multi-year data in this effort. Thanks to all of our volunteers who help make this possible!
