
Exploring Signs of Spring with the Snapshot Wisconsin Data Dashboard
Everyone has a certain seasonal change that tells them spring is around the corner. For me, it’s seeing the crocuses pop up in the yards around Madison, along with hearing the red-winged blackbirds trill in the tall grass. Below are a few examples of Wisconsin wildlife and plants to look for as the snow melts and the temperature and daylight increases.
You can explore the seasonal patterns of different species on the Snapshot Wisconsin Data Dashboard. The Data Dashboard is updated with data from our trail cameras over time. To check out current data as of spring 2021, select a species from the list on the left side. Then, scroll over to the Animal Activity graph on the right-hand side of the page. Select the “by Month” option beneath the graph in order to see what changes typically occur in March.
You’ll find some common springtime patterns captured on our Snapshot cameras, like cottontails as they are increasingly out and about. In fact, the appearance of cottontails is twice as likely in March as it is February.


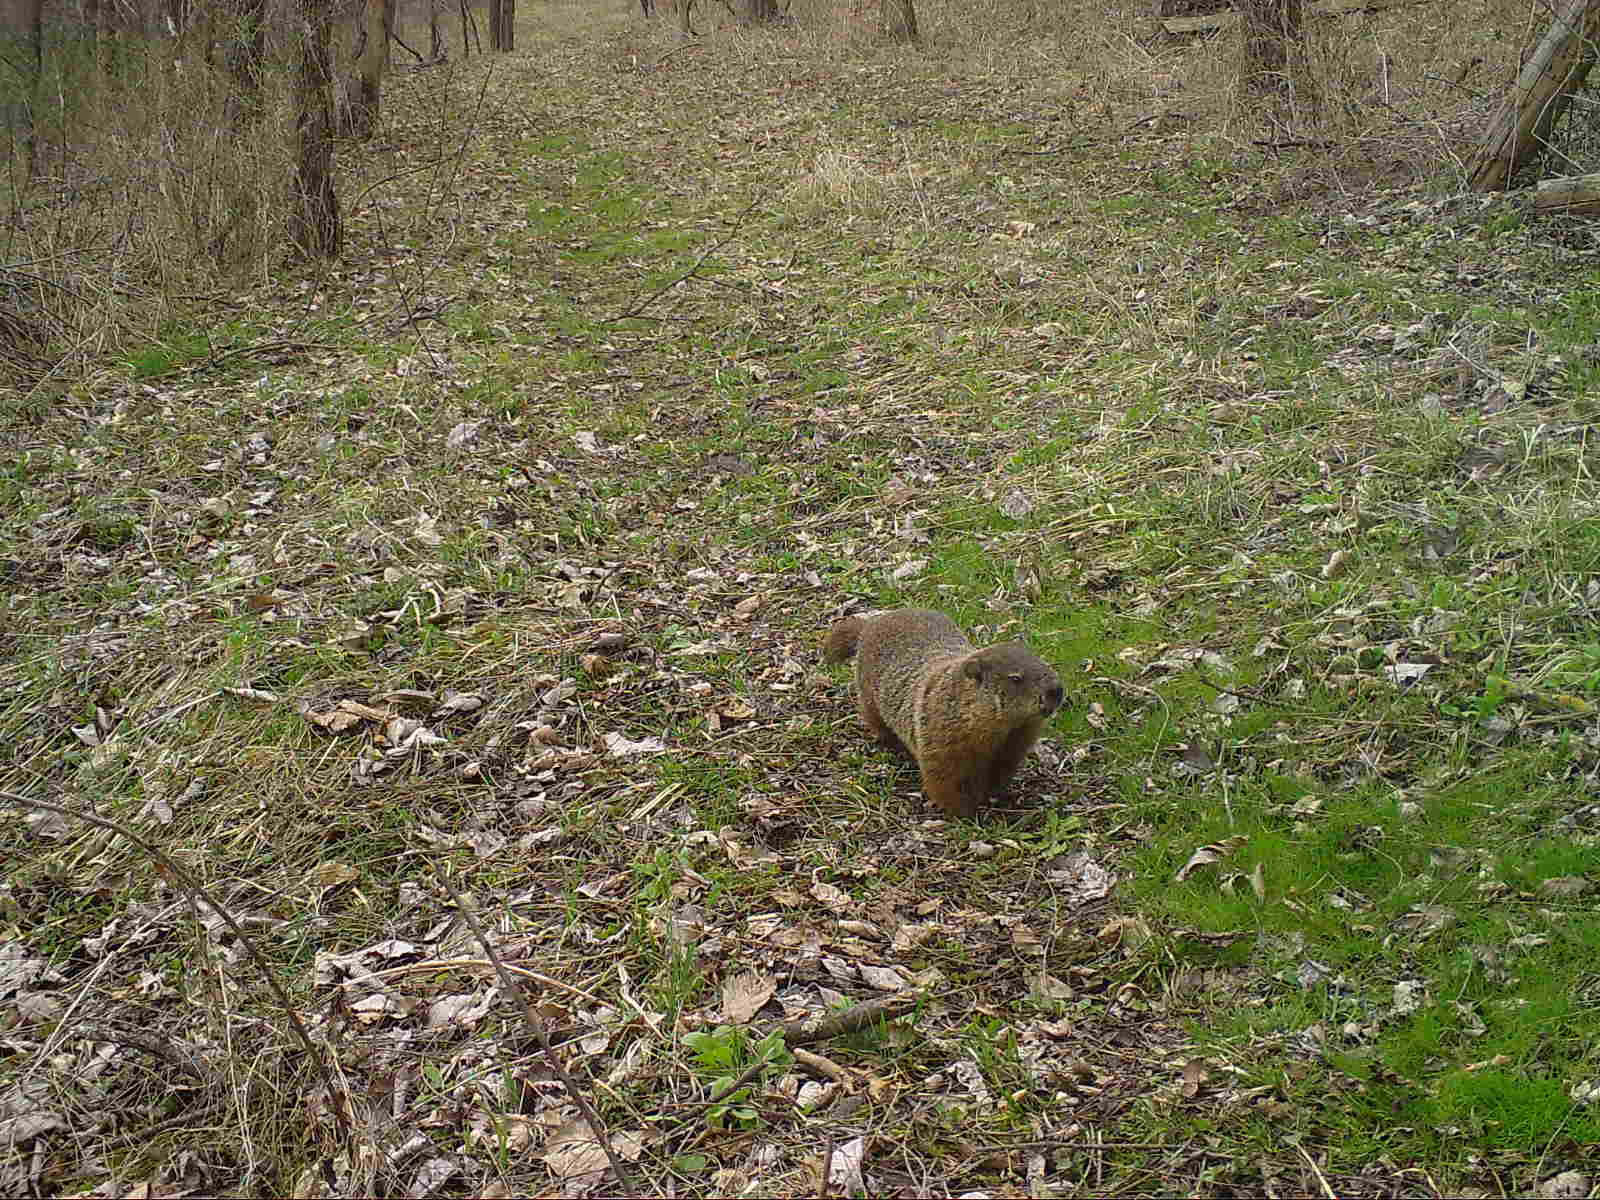
Americans give a lot of power in predicting spring to the groundhog, or as we call it in the classification interface, a woodchuck. We don’t see woodchucks out and about until March on the Snapshot cameras. This is an increase from zero detections in January and February while they are hibernating.

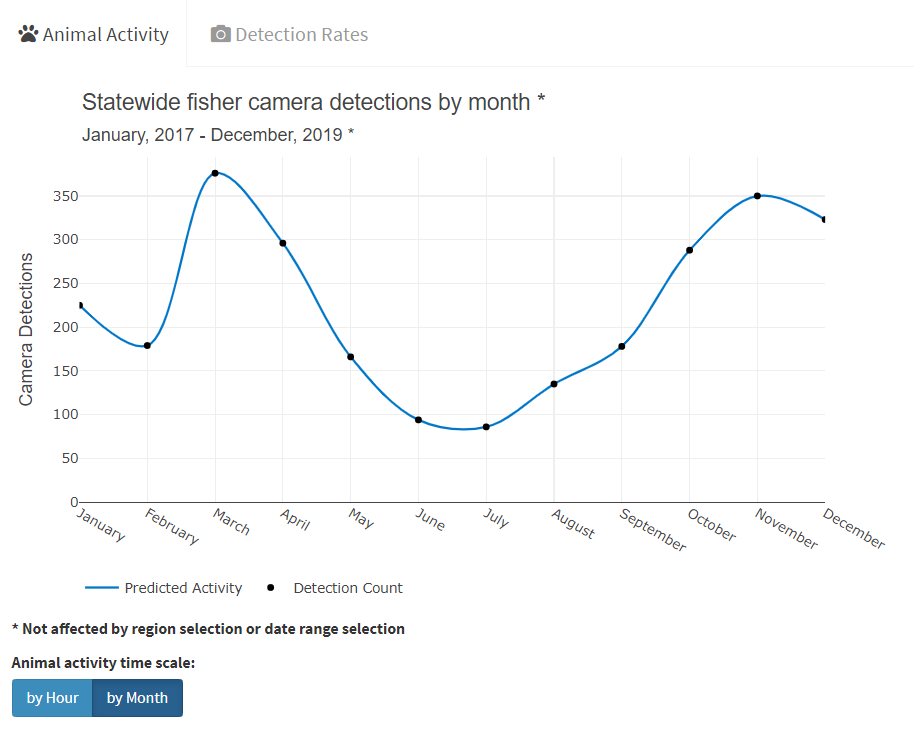
Fishers appear on Snapshot cameras more in March than during any other time of the year! This might be because they usually give birth in February and mate in March and April, so there is a lot of activity in the fisher lifecycle during this part of the year.

One of the most recognizable signs of spring is the return of bird species. You can see that Snapshot cameras capture a huge jump in detection of Sandhill cranes starting in March as they return north.


Although Snapshot Wisconsin is a project focused on the fauna in our communities, there are also a bunch of neat flora to look out for as spring comes around. Keep your eyes out for pussy willows, daffodils, Siberian squill, and other trees, shrubs and ground cover that will begin to blossom in the background of our trail camera photos.
And if you are curious about firsts elsewhere, the USA National Phenology Network posts the status of spring across the country. You can watch as spring comes to different regions and track trends, temperatures, and species as you await the arrival of spring in your own backyard.
Snapshot Saturday: January 26th, 2019
Whether you’re enjoying ice fishing or a fisher enjoying the ice, happy Snapshot Saturday!

Interested in hosting your own Snapshot Wisconsin camera? Visit our webpage to find out how to get involved: https://dnr.wi.gov/topic/research/projects/snapshot/.
Taylor’s Fisher Frenzy

An inquisitive fisher plays around with a non-invasive sampling box.
Before joining the Snapshot crew, I worked on a long-term fisher (Pekania pennanti) monitoring project in a beautiful section of Northern California, called the Klamath-Siskiyou eco-region.
Our study focused on one of two endemic populations of fishers on the West coast found in Northern California and Southern Oregon. Fisher populations declined in the 1800s and early 1900s due mainly to trapping and habitat loss. This study was undertaken 11 years ago in response to a petition to list the fisher as a federally endangered species (which was ultimately overruled).
The goals of the project are to better understand the size and robustness of the western fisher population, explore species interactions between meso-carnivores (such as gray fox and ringtail), and investigate fisher responses to wildfires. It’s a very dynamic and exciting project to work on, with lots of valuable questions to explore.

The red X marks the location of our study area within the fisher’s historical and current range.
We used baited, corrugated plastic boxes at 100 historical locations to track our fisher populations. The boxes were fitted with a metal track plate covered in contact paper and ink, along with a glue strip that caught hair from critters passing through the box.

An example of a fisher paw print compared to my hand. Tracks of fisher, gray fox, spotted skunk, ringtail, and other species were used to calculate occupancy estimates. Hair samples were used to calculate fisher density throughout the study area.
Every day for three months, my co-worker and I would set off into the woods to collect track plates and hair snares. This usually meant 10-12 hour days of driving around the Klamath National Forest, punctuated by steep hikes to retrieve samples in the forest.

The Klamath-Siskiyou eco-region has one of the highest diversities of conifers in the world. The area is marked by steep, rugged terrain and deep, river gorges.
Even though we never outright saw the feisty fishers, we began to expect “visits” from them at our boxes. We collected tracks and hair from the same boxes every week. The fishers certainly appreciated the chicken and cat food we left as bait for them! Our weekly box checks became like meeting up with old friends. At one site, I collected a female’s tracks and hair every week for two months. She never made a mess of the bait or destroyed the box (which I greatly appreciated)!
All in all, I had a terrific experience that helped me to understand the importance of non-invasive sampling (i.e., sampling that does not require capturing animals – like the camera trap method used in Snapshot Wisconsin)!
If you are still curious about the non-invasive sampling boxes, check out this video of the box setup.
Science update: Fisher distribution
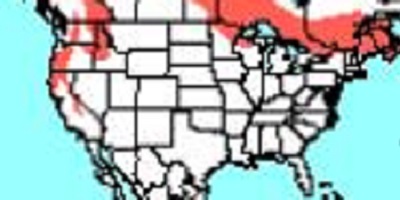
Our July #SuperSnap was all about fishers, and we’re just going to keep on rolling on the fisher train! This science update was inspired by recent comments on a photo of a fisher in central Wisconsin. The location of the photo might cause confusion if you base where fishers *should* be on the range map we have posted. The map shows fisher range extending to only the very northern part of the state:
Whereas we’ve seen fishers on Snapshot Wisconsin cameras in counties pretty far south:

In the case of a species like fisher, which was reintroduced to Wisconsin in the 1950s and expanded its range quickly, static distribution maps go out of date quickly. This brings up a larger point about range maps being inaccurate because they are based on old, incomplete or faulty data. We provide range maps to give volunteers an indication of where they are more likely to find a certain species, but these maps are by no means perfect. The fact that we do not have very good statewide data on the distribution of most species is indeed a major reason for starting a project like Snapshot Wisconsin!
Note that the above map shows counties where we’ve seen Snapshot Wisconsin photos correctly classified as fisher. Many of the gray counties do not have any Snapshot Wisconsin cameras and so we do not have any photos there yet. This is not to say there are no fishers in the gray counties!
