April Science Update: Time-lapse Photos
The Snapshot Wisconsin team is often asked why we accept data only from our Snapshot-specific cameras. While there are several reasons, the reason that was highlighted in the April 2019 newsletter was because Snapshot Wisconsin cameras are programmed to take a single photo at 10:40 a.m. each day. Although 10:40 may seem like an arbitrary time, this corresponds to the approximate time that a NASA satellite flies over Wisconsin and collects aerial imagery. (More information on how NASA data and Snapshot data are complementary can be found in this blog post.)

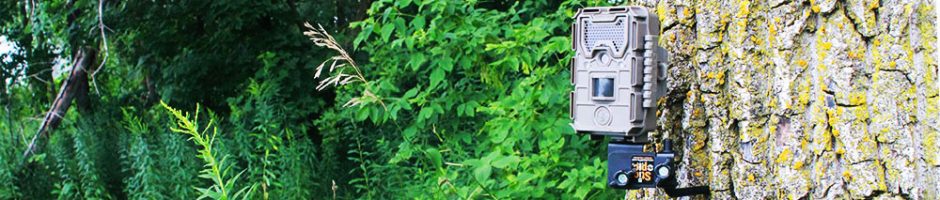
An example of a motion-triggered photo and a time-lapse photo from the same site in Sawyer County, September 2017.
It may be difficult to recognize the value of a blank photo in wildlife research, but a year-long series of these photos allows us to examine something very important to wildlife: habitat condition. For each camera site, the time-lapse photos are loaded into the statistical software, “R,” where each pixel in the image is analyzed and an overall measure of greenness is summarized for the entire photo. That measure, called the Green Chromatic Coordinate, can be used to identify different “phenophases,” or significant stages in the yearly cycle of a location’s plants and animals. These stages can be delineated on a graph, called a phenoplot, where a fitted curve reveals the transition day-by-day. The 2018 phenoplot for one Snapshot Wisconsin camera site is seen below.


Time-lapse photos from the corresponding phenophases as identified by the phenoplot above.
In 2018, 45 camera sites had a complete set of 365 time-lapse photos, but we expect many more sites to be included in the 2019 analyses. The relatively small sample size for 2018 is due in part to many counties not being opened for applications until partway through the year, but also because time-lapse data are rendered unusable if the date and time are not set properly on the camera. This may happen when the operator accidentally sets the time on the 12-hour clock instead of the 24-hour clock, or if the hardware malfunctions and resets the date and time to manufacturer settings—this is why we ask our volunteers to verify the camera’s date and time settings before leaving the site each time they perform a camera check.
The information derived from these analyses will be integrated into wildlife models. For example, the objective of one ongoing DNR research project is to understand linkages between deer body condition and habitat, which includes what’s available to deer as forest cover and food resources, as well as weather-related factors, such as winter severity or timing of spring greenup. The project currently uses weather data collected across the state to estimate snow depth, temperature, and winter severity, and creates maps based off this information.
Snapshot’s time-lapse cameras offer a wealth of seasonal information regarding type of forest cover and food sources, as well as weather-related information. In the future, phenological data obtained from Snapshot cameras could be used to create “greenup maps” that provide estimates of where and when greenup is occurring, and potentially test that information as a means of better understanding how environmental factors affect deer health, such as whether an early spring greenup improved deer body condition the next fall.
